
One of the most striking trends in world economic development since 1960 has been the widening gap between east Asia and sub-Saharan Africa (SSA). While SSA population has grown much faster, east Asians have become much richer and better educated. Economic studies link this to regional differences in students’ math competence, which average three intra-country standard deviations. How much of this is cause or effect, and how social or genetic influences weave in, remain unclear. However, they seem persistent enough that east Asia will likely retain throughout this century a strong comparative advantage in math-heavy occupations, while SSA will remain relatively math-light. In recognition of this, SSA has geared most of its educational systems to focus on basic arithmetic competence, without trying to emulate the world’s leaders.
East Asia—Singapore, Japan, South Korea, Taiwan, and coastal China—regularly dominates the global math tests administered by OECD’s Programme for International Student Assessment (PISA) for 15-year-olds and by Trends in International Mathematics and Science Study (TIMMS) for 4th and 8th graders. The laggards are more dispersed. In the past few years, most countries tested in Latin America, southeast Asia, and the Muslim world—rich city states excepted—had means that were 2.0-2.5 standard deviations lower than the east Asian mean. (My standard deviation measure averages the reported intra-country standard deviations; the aggregate standard deviation is about 20% larger.)
However, countries in South Asia and SSA tend not to be tested, partly due to logistic challenges but mostly due to embarrassingly low scores in experimental runs, ranging from near the bottom of PISA or TIMMS rankings to much lower. Since a dearth of evidence might not evidence a dearth, I used the World Bank’s Human Capital Index for 2020, which is 0.94 correlated with PISA’s 2022 mean scores and 0.86 correlated with TIMMS’ 2023 mean scores for 8th graders. They project a roughly 2.5 standard deviation lag for India relative to east Asia and a roughly 3.0 standard deviation lag for Pakistan and SSA. This is consistent with findings for Senegal and Zambia in 2018 from experiments with “PISA for Development”. A comprehensive report in 2016 for the World Bank corroborated the lags in more detail (see Chapter 3).
These disparities make it very difficult to narrow regional differences in incomes. According to the Penn World Tables database, Singapore, South Korea, and China in 1960 all had lower per capita GDP in purchasing power parity (PPP) than Kenya, Côte d’Ivoire and Nigeria. At the time, most economists viewed economic development as largely a function of infrastructure of fixed capital investment. In hindsight, the statistical measures most correlated with per capita growth have involved human capital. Hanushek and Woessmann, two experts on the economics of education, found that cognitive skills, as estimated by the highly correlated average of math and science scores in TIMMS, explain longer-term rates of economic growth far better than nominal years of schooling:
“School attainment is never statistically significant in the presence of the direct cognitive-skill measure of human capital. One standard deviation in test scores (measured at the OECD student level) is associated with a two percentage points higher average annual growth rate in GDP per capita across 40 years.”
While my previous essays on ethnic and gender disparities posited relatively stable Gaussian distributions, that seems inappropriate in analyzing big differences across countries. The core lags are rooted in poor education: limited hours and offerings, unknowledgeable or uninspired teachers, weak parental and peer support. Each generation that acquires some education will better prime the next. Furthermore, subgroups can set much higher standards and tap into cutting-edge knowhow, making the upper tails much fatter than Gaussian approximations suggest. This is particularly evident in India, whose admissions exams for its top engineering institutes rank among the worlds’ most exacting.
South Asia and SSA do not try to make a single pedagogy handle both extremes. Their main systems focus on raising competencies that PISA and TIMMS consider too low to reasonably evaluate. Two African consortiums SEACMEQ and PASEC monitor students in mostly Anglophone and Francophone countries respectively for degrees of basic learning. Hanushek and Woessmann found that both basic STEM competence and higher-level STEM competence fuel economic growth. While basic levels were less potent than high levels, they were cheaper to produce.
Knowledge Capital
Hanushek and Woessmann frame cognitive skills as “knowledge capital”. This helps defuse the nature versus nurture arguments that derail many discussions of intelligence. Slower learners may surpass faster learners if they study longer and harder. In that sense, mean scores on standardized tests of 10-year-olds to 15-year-olds invariably mislead. What most matters is how much competence they eventually acquire. Pace and interim levels gain credence mainly because diplomas are tied to years in school.
However, the term “knowledge capital” misleads too. It is not the stock of know-how that humans most value, or else LLMs would immediately replace us. Rather, it is the ability to process new information, drawing on what we already think we know, which includes discarding what we thought was true but evidently isn’t. Education fortifies that ability. Indoctrination numbs it. Two of the great advantages of math education are that it encourages creative problem-solving and provides clear ways to identify errors.
Another shortcoming of the term “knowledge capital” is the hint of exclusive property rights. In practice, most know-how eventually gets shared widely, and most institutions that cultivate know-how aim to share it faster even if they ring-fence some against commercial rivals. It follows that what we most want of teachers is good cognitive skills that they share. The more eager and advanced the students, the more cognitive skills the teacher needs. Conversely, with struggling students—particularly students struggling not to be there—teachers need to act more like drill sergeants drumming in fundamentals even if they veil it nicely.
When the majority of students fall well below desired standards, schools naturally focus on remedial help. Absent ability grouping, this leaves a talented minority underserved. While advanced online learning is more accessible than ever before, it tends to leave learners feeling isolated. Humans are such social animals that most prefer learning with each other than learning on their own. Perhaps LLMs can learn to provide a more emotionally satisfying engagement.
In the meantime, the teacher-led classroom of mixed abilities remains the overwhelmingly dominant form of instruction. With few exceptions, East Asian classrooms cover significantly more advanced material than corresponding African classrooms and stretch faster learners more. This expands east Asian diversity in math competence relative to African diversity. It is very hard to counter this as advanced training generally helps the best learners most. For the 81 countries tested by PISA in math in 2022, internal standard deviations were 0.8 correlated with means.
It follows that east Asia will tend to outperform SSA even more in the top tiers of math competence. Of course, this does not rule out major outperformance by African individuals or subgroups, which we should scout for and promote. I am simply noting a statistical regularity that will shape global inequality for the rest of this century. The ethnic disparities in the US look relatively mild in comparison.
Social Justice Critique
From a “social justice” perspective, core differences in group performance are mostly relics of Western colonialism or products of capitalist oppression. Enlightened elites trained at progressive universities could blaze a better path forward. Racial/ethnic targets for STEM admissions, hiring, and promotion would narrow the gaps without impairing quality.
Unfortunately, the evidence refutes these musings. Let’s start with the universities’ own experiences. They were founded and aided on the principle that top professors working with top students added more valuable social know-how than random shuffling or intentionally coupling weak with strong. In the short run that is bound to widen disparities in competence, even though the brewed know-how eventually percolates more broadly.
As for colonialism, three of the world’s top performers in general math competence are former colonies: Singapore, Hong Kong, and Macao. The two lowest ranking countries in PISA 2022 math tests were Cambodia and Paraguay, whose colonial yokes were much milder than their neighbors’. This should not surprise, since the main disparity between colonizers and colonized was the former’s better grasp and application of STEM. Japan’s successful pushback against colonialism hinged on its rapid mastery of Western know-how.
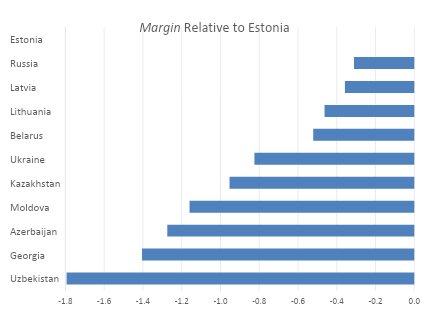
As for capitalist oppression, a previous essay noted that over half a century of ardently anti-capitalist rule in the Soviet Union left big ethnic disparities in STEM representations. While that partly reflected Russian nationalist influences, the dissolution of the Soviet Union in 1991 has given the former Soviet republics a generation to gain or regain their independent bearings. Eleven of them took PISA tests between 2015 and 2022. I have averaged their scores and measured the Margins versus top performer Estonia as the mean gap in performance divided by the mean intra-country standard deviation. The Margins average -0.9 with Uzbekistan 1.8 behind Estonia, and the untested Central Asian countries would likely have been lower.
For a broader perspective, we can compare the PISA math scores and log per capita GDP in purchasing power parity terms for all countries formerly in the Soviet bloc or socialist Yugoslavia. The correlation is 0.83. Each 1.0 improvement in Margin is associated on average with a doubling of per capita GDP.
Why is the correlation between math competence and per capita incomes so high? I don’t know. One partial explanation—namely, that STEM education raises competence and productivity—seems so potentially cost-effective that it seems silly not to make it a development priority. However, there are no signs that education per se equalizes group performance. The rising tide seems to lift the best boats highest.
Not just globally, math divides w/in the US as well - in a recent seminar regarding getting your kids into college and having them graduate from college - it was noted that their competence in Algebra is the single best predictor of whether they get in and succeed in college.
Don't kids learn algebra in middle school?--- so one can already sense by middle school if one is "on track" for traditional success?
I am curious where Romania and Hungary fall. They have cultures that strongly favor mathematics.
Some of this "mathematical culture" might be due to genetic factors, and some to environmental factors. How we untwist those is a very complicated and difficult question.
I can give plenty of examples of people with genetic backgrounds from SSA who can do very well in mathematics, given the appropriate environments. So I am unsure about what it all means, exactly.