

Disparate Impacts in Two Sports

Blacks visibly dominate top football and basketball in the US, two arenas that once excluded them. This is welcome both for the masteries on display and the fading of white racism among coaches and fans. However, it convincingly refutes claims that, absent discrimination, no human race or ethnic group would have any decided social/genetic advantages over others. The empirical evidence seems most easily explained as a mean statistical advantage for Blacks of about 0.75 standard deviations in basketball and 0.6 standard deviations in football. Asian Americans have a mean statistical disadvantage of about 0.9 standard deviations. These differentials do not justify generalization about any particular person. Neither do they indicate that race “causes” skills in these two sports. However, they do warn against treating the disparate representation as a justification for de facto racial quotas.
The comparisons are relevant to STEM as the statistical advantages there, which slant in the opposite direction, are widely believed to justify legal or administrative redress. While I do not examine that data here, sports experience raises some doubts about remedies. I do hope to persuade that statistical parsing of these issues is not inherently prejudiced.
By every major measure—money spent, revenue generated, TV viewership, attendance, and fan interest—football and basketball are by far the two most respected and prominent Division I college sports in the US. They are also the two most respected and prominent pro sports, although baseball commands the most attendance thanks to vastly more games. Their rising popularity since 1950 is also strongly associated with dominance of Black athletes. While correlation is not causation, it testifies to diminution of the white racism that once excluded Blacks from these sports or kept them in inferior positions. Mindful of historic concerns, both Division I and professional sports authorities maintain extensive data on racial representation, which any AI engine can easily access. The following analysis draws on that data.
In 2023, Blacks comprised an estimated 12.8% of the male US population aged 20-24, which is the primary recruitment pool for pro athletes. Blacks comprised 70.4% of the NBA’s 539 players. Both estimates exclude declared multiracial categories. If top basketball talent were completely independent of Black/non-Black distinctions, a Black share that high or higher would be a 37-standard deviation outlier with chance of 10^(-208). It is hard to wrap one’s mind around such a preposterously low number. It corresponds to the chances that
20 randomly chosen 12-person juries from across the US don’t include a single Black.
the next 23 meteor strikes in the US hit the same one-acre plot of land.
25 successive Powerball jackpots are won by the same person buying only one ticket for each pot.
75 injunction requests filed randomly with the 631 currently active federal district judges all go to the same judge.
Let’s turn to pro football. In 2023, an estimated 53.5% of the NFL’s 1696 players were Black. If top football talent were completely independent of Black/non-Black distinctions, a Black share that high or higher would mark a 54-standard deviation event, with chance much less than 10^(‑330). The lower odds reflect the NFL’s employment of nearly triple the players the NBA does, which outweighs the lower Black share. AI engines refused to compute the chance, saying it was effectively zero and unlikely to have occurred even once in the history of the universe.
We can recover a sliver of plausibility, or rather a sliver of a sliver, by treating the NBA and NFL as confined to drafting college Division I players. Black shares of Division I athletes in 2022 were estimated at 52.4% for basketball and 44.7% for football. This hikes the chance of the NBA randomly recruiting at least 70.4% Blacks players to one in 100 quadrillion and the chance of the NFL recruiting at least 53.5% Blacks to one in 50 trillion. Of course, these chances remain far too low to take the “fully random” hypothesis seriously; they just shuffle much of the disproportionate filtering to colleges.
Black Outperformance
The only alternative that can plausibly fit the statistical data accords a distinct statistical edge to top Black football and basketball players. This does not mean that Blackness creates that edge, just that it is generally associated with it. Nor does it mean that the association is genetic; in principle the edge might stem from purely environmental influences. Most likely it presents a mix of nature and nurture, with each side reinforcing the other. Natural edges encourage more attention to cultivating them—attention from self, parents, neighbors, and friends—while cultivation enhances the edges. Perhaps there are also epigenetic influences, where gene expressions trained by one generation get inherited in the next. It is often estimated that social and genetic influences are roughly equal in importance, but that might reflect more uncertainty than conviction. I will call the combination “socgen” without attempting to subdivide.
A socgen influence is most easily modeled as a shift in the mean of a statistical distribution and I will focus mainly on that. The biggest question concerns the distribution. I make the usual Gaussian choice, which generally does a good job of capturing lots of random independent noise. (One caveat is that mixtures of Gaussian distributions are generally not Gaussian, with higher risks in the extreme tails than Gaussian proxies suggest. My empirical estimates adjust for this.) Below are two such distributions charted in standard deviation terms with means 0.6 standard deviation apart. Let’s call them Low and High.
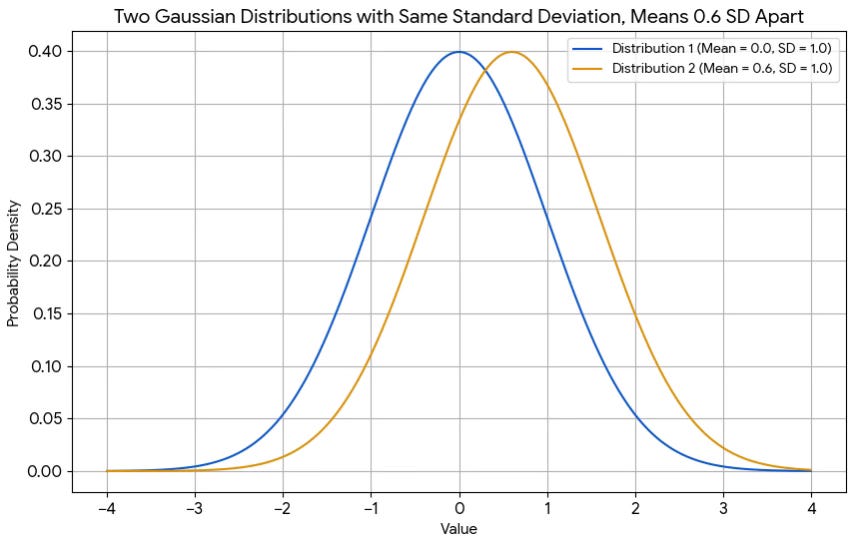
The bell shapes concentrate 95% of observations within two standard deviations of their means and drop off steeply in the tails. If we pick one athlete randomly from each distribution, there’s about one chance in three that the athlete from Low outperforms. However, the top athletes are disproportionately likely to come from High. In the chart below, the solid line plots the ratio of upper tails. If we measure performance by standard deviations above the Low mean, High athletes are about five times as likely to exceed 2.6 as Low athletes. The dotted line plots the corresponding ratios for means 0.7 standard deviations apart.
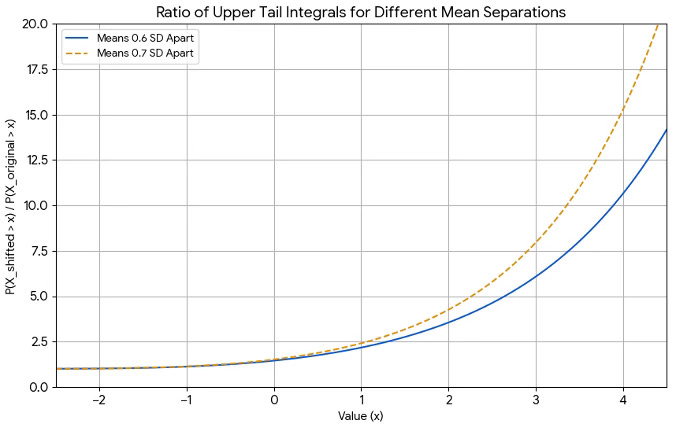
I will call the value on the x-axis Threshold, the ratio on the y-axis Outperform, and the mean separation in standard deviations Margin. As we can see, Outperform is highly sensitive to both Threshold and Margin. When Threshold rises from 2.6 to 4.0, Outperform rises to 11 for Margin 0.6 and 15 for Margin 0.7.
Two populations might also differ in variance (standard deviation squared). The higher the variance, all else being equal, the more the population stands out at both extremes. For example, females have 7%-10% lower relative standard deviations than males in some characteristics. Coupling that with distinctly lower average height and weight, few if any people-born-female will likely ever play in the NBA or NFL. Consequently, my athlete pools are male-only. However, my comparisons of top Black and non-Black football or basketball players found only modest evidence of differences in variance. This allowed approximation of differences by Margins alone.
I estimate a Black Margin versus non-Blacks of about +0.75 in basketball and +0.6 in football. Note that the Margins arise without any evident discrimination against the lagging group. This challenges the frequent legal presumption that disparate group results reflect disparate group treatment unless proven otherwise. It also reassures that a combination of legal rights, competitive pressures to reward excellence, and cultural tolerance for disparate impact can allow previously excluded groups to shine.
Asian Underperformance
The data also provide evidence of Asian underperformance. Here “Asian” uses the standard US race-spanning definition that covers anyone of south Asian or east Asian ethnic background. It excludes the small group of Pacific Islanders (e.g., Hawaiians and Samoans), who are classified differently and currently significantly outperform in football.
The shares of Asian athletes are 0.2% in the NBA, 0.1% in the NFL, and 0.3% in Division I for both basketball and football. These are much smaller than the 5.5% estimated share of Asians among Americans 20-24. Absent underperformance, the chance of such low shares in Division I is again much less than 10^(-330). The least wildly improbable is the NBA share, with a chance of 1 in 100 trillion.
My estimated Asian Margins versus non-Asians are roughly -0.85 for basketball and -0.95 for football. The highly negative values are consistent with Asians’ significantly lower average height and weight, which are distinct disadvantages in those two sports. While there are hints of higher Asian variance in basketball, this likely reflects an infusion of foreign Asian talent into the NBA.
Note the implied intermediate position of whites. Old notions of natural white supremacy were not just vile; they were also doubly stupid. Stupid first because there are so many diverse ways to excel through genetic advantage, social advantage, or hard work. Stupid second because a host of socgen metrics place Europeans intermediate between Africans and Asians.
Note also the large differential between Asian Americans and Blacks. Since the non-Asian and non-Black benchmarks differ, we should not simply subtract one Margin from the other. However, the overlap is small and suggests a net Black/Asian Margin in football and basketball of roughly +1.5. Assuming roughly Gaussian distributions, Blacks will outperform in random Black/Asian pairings about six times out of seven. Thankfully, this differential has not sparked any public pressure to restrict drafts of Blacks into the NBA or NFL. However, a reverse differential in STEM proficiency has induced some elite universities to restrict Asian admissions. Disparate impacts evidently receive remarkably disparate attention. Would that professional academics gain the tolerance and wisdom to emulate professional sports.
Estimation Details
Statistical estimates are a bit like sausages: better savored when you don’t watch them being made. Nevertheless, I feel obliged to reveal the preparations here, to better acknowledge the doubt essential to healthy STEM. Read at your own digestion risk.
The biggest challenge in Margin estimation is figuring out the appropriate pool. Playing careers in these groupings average roughly four years—slightly less in the NFL due to injuries and slightly more in the NBA—so I will use a four-year male cohort. One possibility is the pool of male high school athletes, where a reported 1.064 million play football and 537 thousand play basketball. However, that already selects or self-selects from the better-talented or motivated tiers. Another challenge is that some data on Blacks and Asians includes people identifying as mixed race or ethnicity and some does not.
For breadth and consistency, I decided to use Census Bureau estimates for age and sex in 2023 from the American Community Survey. For the 11.07 million males between ages 20 and 24, 12.8% were identified as Black only and 5.5% as Asian only. The Black Outperform ratios work out to 16.2 for the NBA, 7.5 for the NFL and Division I basketball, and 5.5 for Division I football. The Asian Outperform ratios are all tiny: 0.017 for the NBA, 0.034 for the NFL, and 0.052 for Division I in both basketball and football.
To generate a 4-year cohort, I multiplied the 5-year numbers by 0.8. At first glance, we might use the same pool for both basketball and football. However, this implicitly treats the two sports as one. To separate them, I divided the cohort into the 1:2 observed division in high school basketball and football. This yielded a 2.95 million Pool for basketball and a 5.9 million Pool for football.
Let us analyze Black outperformance first. For the NBA, the implied Threshold=3.8 with Margin=0.75. For Division I basketball, the 18.8 thousand Athletes imply Threshold=2.7 with Margin=0.76. As the two Margin estimates are only 0.003 apart, they support the treatment of Black and non-Black variances as equal.
For the NFL, the implied Threshold=3.6 with Margin=0.56. For Division I football, the 33.4 thousand Athletes imply Threshold=2.7 with Margin=0.63. There are basically two ways to interpret this. One is an average Margin of 0.6 with equal variance, where we attribute the differences to noise. The other is a base Margin of 0.8 with about 10% smaller standard deviation. Either approach tries imperfectly to capture the reality that some football positions (e.g., offensive line) exhibit more relative parity than others.
Turning to Asian/non-Asian distinctions, the implied NBA Threshold=3.5 with Margin=-0.81. For Division I basketball, the implied Threshold=2.5 with Margin=-0.92. I suspect that the NBA Margin has been reduced by the recruitment of foreign Asian stars. The implied NFL Threshold=3.4 with Margin=-0.98, while the implied Division I football threshold is 2.5 with Margin=-0.91. Since Black outperformance raises the non-Asian mean by about 0.1 standard deviations, I estimate the Black versus Asian Margin as roughly 1.5.
Here are the equations used. Let sharePool denote a subgroup’s share of the candidate pool as sharePool and shareSport its share of athletes in the given sports division. Outperform is the relative odds ratio:
Let F(Threshold) denote the upper tail probability for a Gaussian distribution, where the tail starts Threshold standard deviations above the reference group mean. It equals one minus the standard cumulative normal distribution. The corresponding upper tail probability for the subgroup is F(Threshold) times Outperform. For a mixed Gaussian distribution of subgroup and reference group, the upper tail probability is a weighted average of the preceding, with weights of 1‑sharePool and sharePool respectively. We want to equate this to the observed ratio Athletes/Pool of athletes to pool size. Hence
It follows that
and
To those interested in the subject of "unequal representation implying discrimination", I can recommend Thomas Sowell's book "Social Justice Fallacies". It is a 130 page text with no formulas plus 60 pages of bibliography. The representation of races in sports is just one example (actually Sowell says that the Major League baseball is dominated by Hispanics, while Blacks are dominant in the US basketball) of what he calls "equal chances" fallacy, the theme of the book's first chapter. In this chapter Sowell claims (and provides a myriad of examples supported by 98 references) that it is hard to find a single walk of life where proportional representation of different ethnic groups is observed. Instead, he shows, the phenomenon commonly observed is "reciprocal inequalities": it is similarly hard to find an ethnic group that would not be better than most at least in something. Sowell also identifies numerous causes of the phenomenon. But "equal chances" is only one of the fallacies of the Social Justice ideology discussed in the book (spoiler: it has 5 chapters) - which is written with disarming clarity and eloquence.
I've yet to see any attempts to address the disparate impacts in these sports...why is that? Where is the DEI?