
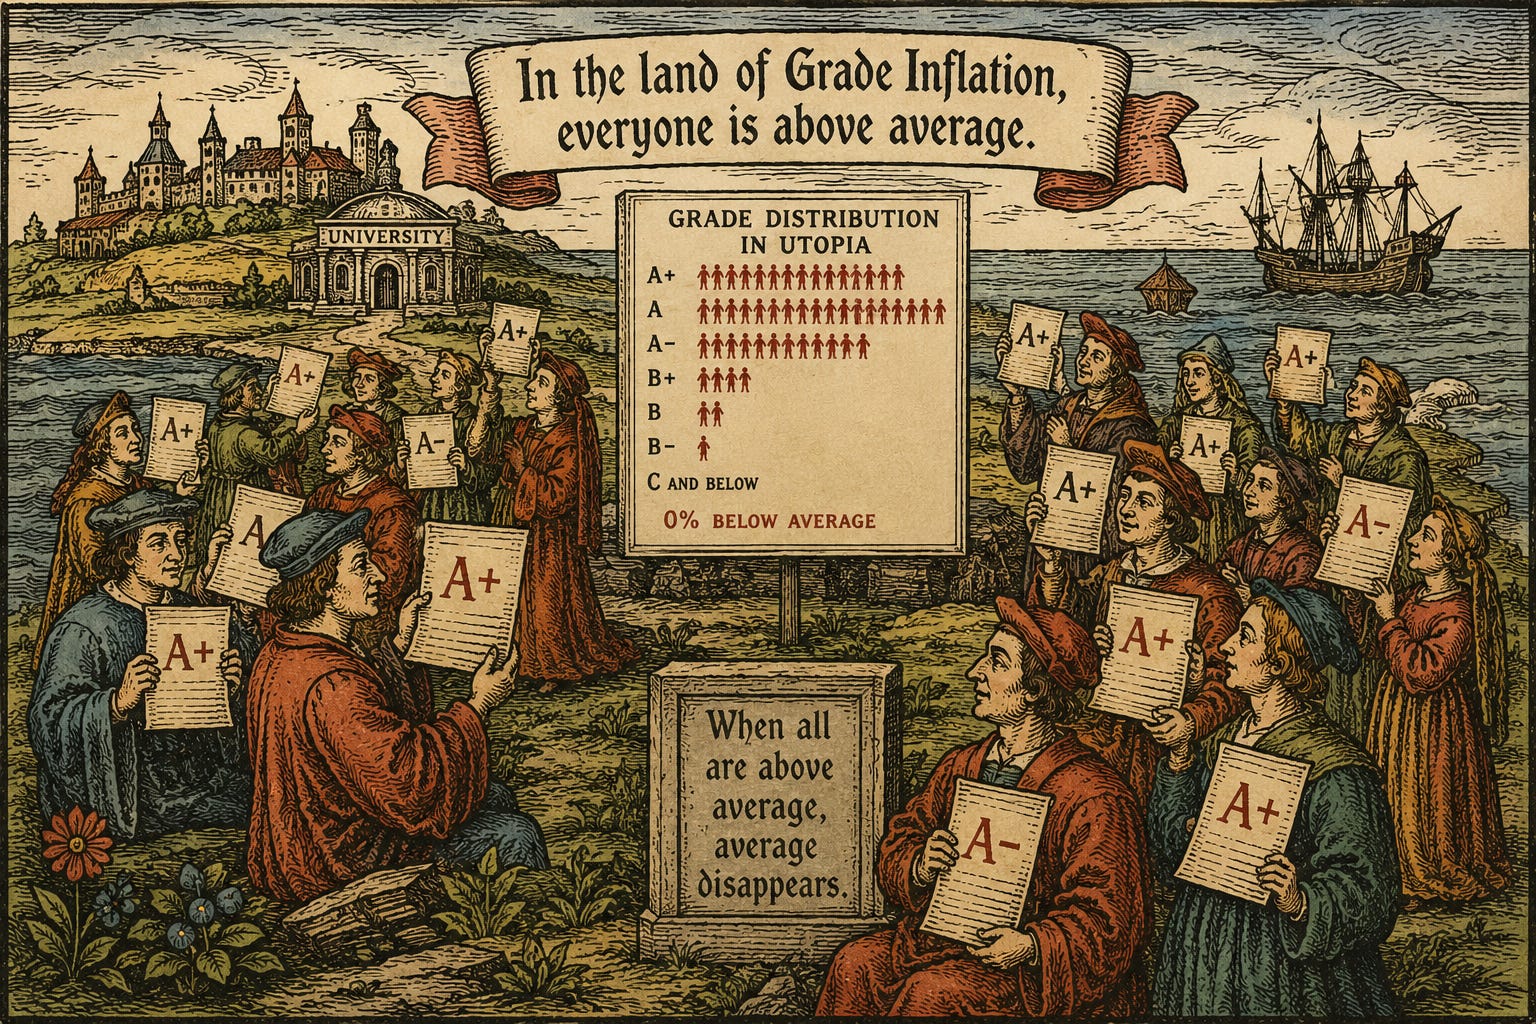
Academic grades typically range from F to A+, corresponding to a numerical range of 0 to 10, say: A = 8, A+ = 10, D = 2, etc. Grade inflation just means that the percentage of students who get very high grades, A or more, rather than being a small minority, in some schools now amounts to a substantial majority. For example, Harvard University internal reports in 2020–21 showed about 79% of grades were A-range, and by 2024–25 nearly 85% were A-range, according to faculty proposals to curb grade inflation. Yale reported that in 2020–21, 81.97% of Yale College grades were in the A range.
If grades are to mean anything, to convey useful information, they must correspond to the quality of students’ performance, they should not be influenced by other factors, certainly not in a directional way.
The reasons for grade inflation are relatively straightforward. Now the habit is well-established. Change, if it occurs at all, is likely to be slow. There is however a simple solution to the symptom if not to its cause.
Normalizing
When grade inflation first came to my attention at Duke University more than two decades ago, I suggested this simple solution to a group of colleagues on an academic committee. To my surprise (a tribute to my naivete, I suppose) no one liked it. I would have been perfectly happy with it as a teacher myself, but my colleagues were unimpressed.
The solution involves coercive action by university higher ups, certainly a limitation of academic freedom, of a sort. But not to content, just to process.
The solution to grade inflation is simply to assign each teacher, call her Amy, a fixed amount, say 5, merit points for each student in her class. The total for each class will therefore be 5N, for a class of N students. Amy is free to allocate numerical points as she wishes, but because the normalized point total is limited, grade inflation is impossible:
Here is an illustration (from an Excel spreadsheet) of how this works for a class of 10 students, with an allocation of 5 points per student, 50 total. The assigned grade distribution shows Harvard-level grade inflation.
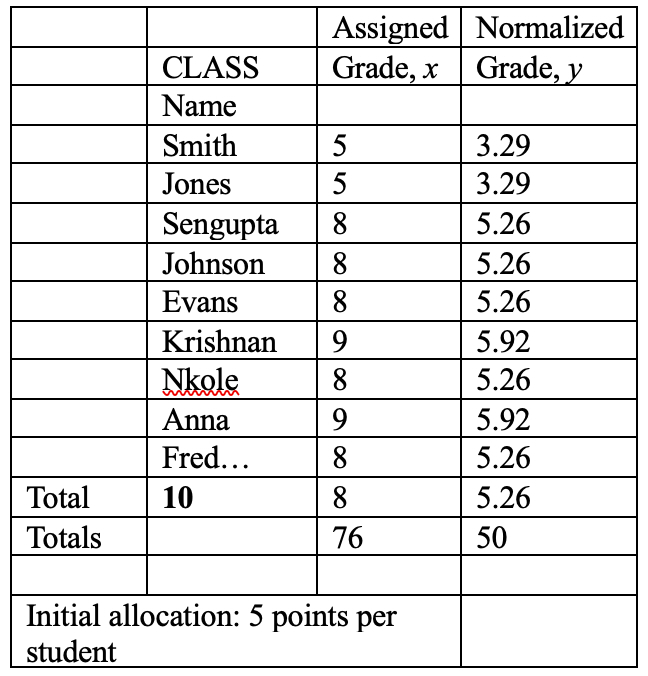
The leftmost column just lists some of the students. The second column shows the assigned grade, x. Most of the x grades are A or above, grade inflation, and the total, now 76, has exceeded the 50-point limit. The rightmost column shows the normalized grades: y = x(50/76). Now no grade qualifies as an A, the 50-point total is restored and there is no grade inflation.
This procedure mathematically eliminates grade inflation. But some flexibility is possible. If Amy can convince an oversight committee that a particular class is especially brilliant, for example, she can be awarded extra points.
Conversely, if a particular class looks very bad, she can give grades that do not use all her allowance. But in this case the normalized grades will be higher than the assigned grades. She then has the option of accepting her assigned grades or the inflated normalized grades, neither showing grade inflation.
This scheme is so simple and obvious it is surprising that it seems never to have been discussed, much less implemented.
J. E. R. Staddon
James B. Duke Professor Department of Psychology and Neuroscience. Professor, Department of Biology, Emeritus, Duke University.
Any technical solution, obvious and clear as some may be, misses the point. Those with grade inflation are AFRAID to remedy grade inflation because of being called racist, student complaints, ...
Technology is not the solution. The courage to apply good standards is.
At the University of Alberta, where I was an undergraduate, we used the so-called "stanine system". Students were given grades on a scale of 1 to 9. It is also possible that there were zeros as well; I do not recall. Nominally, 8 and 9 were As, more or less. The grade of 9 was reserved for A+. The grades 6 and 7 were roughly Bs. And so on and so forth.
However, they also published the mean grade for each class, and the enrollment in the class. This was so that outsiders could judge the rough distribution of the class and where the student stood relative to the rest of the distribution. Of course, class ranking might have also helped. Standard deviation could have been useful as well.
I am not sure if they still use this system. It was in use when I was there from 1974-1979.